

Quick Answer: A business plan for car sales is a strategic document that outlines your dealership's market position, financial projections, operational structure, and growth objectives. For dealerships, Turo hosts, and automotive photographers, a well-structured plan is essential—it secures financing, aligns your team around clear goals, and provides a roadmap to scale profitably while managing the unique challenges of automotive retail and online inventory management.
Creating a business plan for car sales isn't about checking a box for your bank. It's about crystallizing your vision into actionable strategy. Whether you're launching a dealership, scaling a fleet rental operation on Turo, or building a photography business that serves multiple clients, your automotive business strategy needs to account for inventory costs, seasonal demand fluctuations, customer acquisition expenses, and the operational complexity of managing vehicle photography, logistics, and compliance.
The stakes are real. Dealerships with documented business plans report clearer profitability metrics and faster decision-making during market shifts. Without one, you're navigating blind—guessing at cash flow, underestimating marketing spend, and losing leverage when negotiating with lenders or investors. This guide walks you through building a dealership business plan that actually works: one grounded in realistic assumptions, competitive analysis, and the specific operational demands of automotive sales.
You'll learn how to structure your financials, define your market position, and optimize your operations—including how professional-quality vehicle photography directly impacts your conversion rates and justifies your marketing budget. By the end, you'll have a complete roadmap to launch, scale, or refinance your automotive business with confidence.
Table of Contents
- Five Core Sections Every Car Sales Business Plan Must Include
- Executive Summary: Your One-Page Pitch
- Market Analysis: Understanding Your Competitive Landscape
- Operations & Sales Strategy
- Financial Projections
- Management Structure & Team Qualifications
- Building Your Sales Strategy and Operational Model
- Defining Your Sales Velocity and Unit Targets
- Protecting Margin Through Smart Sourcing and Pricing
- Financial Projections: Translating Operations Into Numbers
- Calculating Minimum Capital Required and Startup Costs
- Staffing Plan and Headcount Trajectory
- Practical Steps to Write and Finalize Your Car Sales Business Plan
- Validating Your Assumptions and Setting Realistic Targets
- Preparing Your Plan for Lenders, Partners, and Investors
- Frequently Asked Questions About Car Sales Business Plans
- Taking Action: Next Steps to Build Your Car Sales Business Plan
Five Core Sections Every Car Sales Business Plan Must Include
A dealership business plan isn't a theoretical exercise—it's your operational blueprint. Lenders, investors, and your own management team need to see five distinct, well-developed sections that demonstrate you've thought through every critical dimension of your automotive business. Each section serves a specific purpose: some convince external stakeholders to fund you, others keep your internal operations aligned and accountable.

Executive Summary: Your One-Page Pitch
Write this section last, even though it appears first. Your executive summary is a distilled version of everything that follows: a compelling, one-page overview that captures the essence of your dealership strategy.
Include your business overview (what you sell, where, and to whom), your target market demographics and buying behavior, and your unique value proposition—what sets your dealership apart from competitors. Add financial highlights: projected first-year revenue, gross margin targets, and break-even timeline. State clearly how much funding you need and how you'll deploy it (inventory acquisition, marketing, facility improvements, working capital).
Investors and lenders often read only the executive summary before deciding whether to review the full plan. Make it crisp, confident, and grounded in realistic numbers. Avoid vague language like "significant growth potential"—instead, anchor claims to specific market data or operational advantages.
Market Analysis: Understanding Your Competitive Landscape
Your market analysis demonstrates that you understand the terrain you're entering. Research local competition: identify dealerships within your geographic radius, document their inventory mix, pricing strategies, and customer reviews. Analyze customer demographics—age, income, vehicle preferences, financing needs—to validate that demand exists for your target segment.
Assess pricing trends by monitoring comparable vehicle listings across platforms and auction data. Understand seasonal demand fluctuations (spring buying surges, year-end clearance patterns) so your cash flow projections account for revenue variability. Identify gaps in the market: perhaps competitors focus on luxury vehicles while demand for affordable used sedans is underserved, or Turo hosts in your region lack professional-quality vehicle photography, creating an opportunity to differentiate through visual presentation.
Data-driven insights here directly inform your sales targets and marketing budget allocation. A business plan that cites specific competitor weaknesses and documented local demand is far more persuasive than one based on assumptions.

Operations & Sales Strategy
This section outlines how you'll actually run the business day-to-day. Describe your sales process: how leads are generated, qualified, and converted. Detail your inventory management approach—how many vehicles you'll stock, turnover targets, and sourcing strategy (auctions, trade-ins, wholesale partners).
Address operational logistics: staffing structure, facility requirements, technology systems (CRM, accounting, inventory management). Include your marketing and customer acquisition strategy, specifying channels (digital advertising, social media, local partnerships) and expected cost per acquisition. This is where professional-quality vehicle photography directly impacts your numbers: high-quality car photos boost conversion rates and reduce time-on-lot, which improves cash flow and justifies your marketing spend.
Compliance and legal requirements belong here too—licensing, insurance, regulatory obligations specific to your state or region.
Financial Projections
Translate your strategy into numbers. Build a 12-month cash flow forecast showing monthly revenue, cost of goods sold (vehicle acquisition), operating expenses (payroll, rent, utilities, marketing), and net cash position. Project a three-year profit-and-loss statement and balance sheet.
Your projections must reflect realistic assumptions: average vehicle gross margin (typically 8–15% for used vehicles), sales velocity (how many vehicles per month), and expense ratios benchmarked against industry standards. Sensitivity analysis matters—show how your plan performs if sales are 20% lower than projected or if acquisition costs spike.
Lenders scrutinize these numbers heavily. Conservative, well-documented assumptions build credibility far more than optimistic projections without supporting detail.
Management Structure & Team Qualifications
Investors fund people as much as they fund ideas. Document your management team's experience: years in automotive sales, track record of profitability, relevant certifications or credentials. Identify key roles (general manager, sales manager, finance manager) and the qualifications you'll hire for.
If you're a solo operator or small team initially, acknowledge gaps honestly and explain your hiring roadmap. Describe your advisory board or mentors who bring automotive expertise. This section answers the implicit question: "Can these people actually execute this plan?"
A complete dealership business plan ties all five sections together into a coherent, defensible strategy. Each section reinforces the others—your market analysis justifies your sales targets, your operations plan explains how you'll hit them, and your financials prove the math works.
Building Your Sales Strategy and Operational Model
Your sales strategy and operational workflow form the backbone of dealership profitability. Without a clear process for converting leads into sales and managing inventory efficiently, even the best market position collapses under operational friction. This section translates your market analysis and financial targets into actionable daily operations.
Defining Your Sales Velocity and Unit Targets
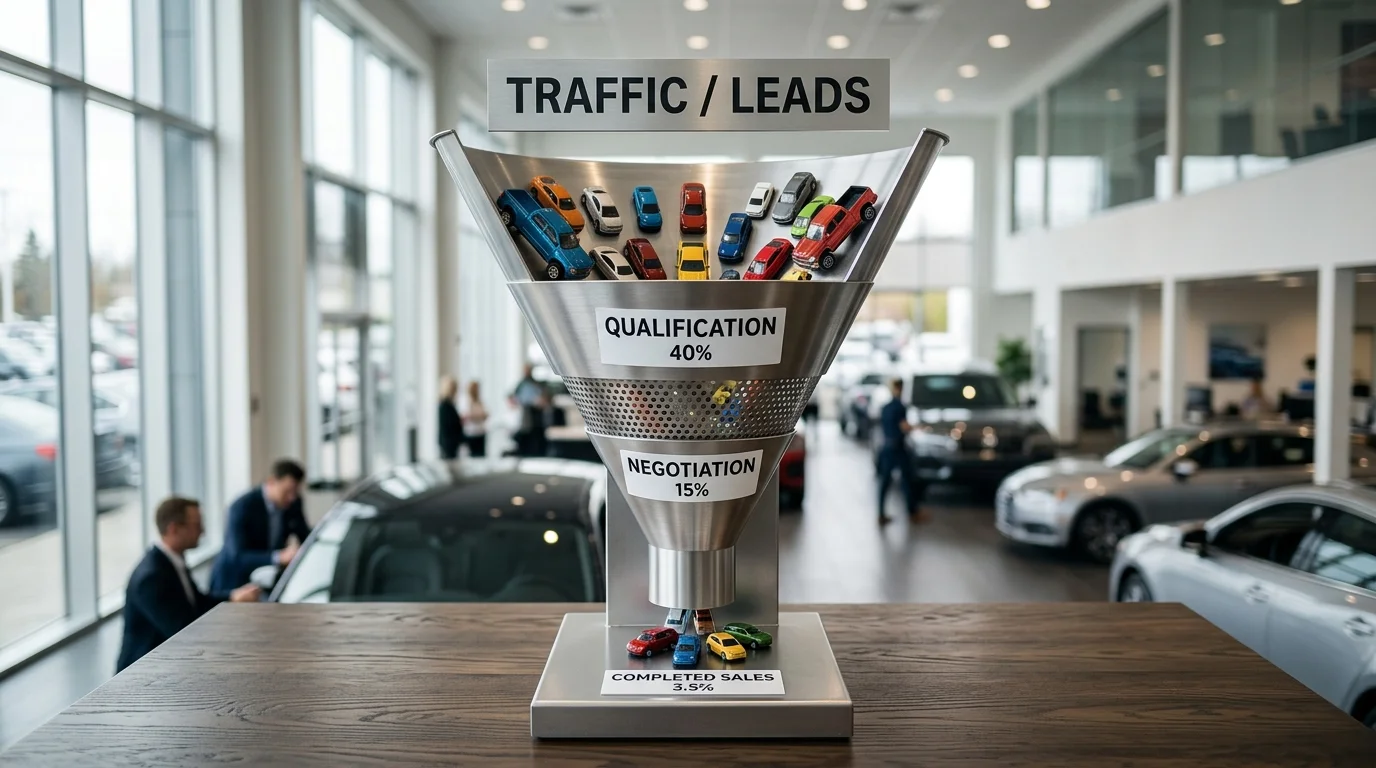
Unit targets must be grounded in traffic volume and realistic conversion assumptions, not wishful thinking. Start by calculating how many qualified prospects you need to visit your lot or showroom monthly. If your market analysis identifies 500 potential buyers in your territory each month, and you capture 10% of their attention through marketing, you're working with 50 qualified prospects. At a 5% conversion rate—a reasonable benchmark for dealerships with solid follow-up—you close 2.5 units per month, or 30 units annually.
This math matters because it forces you to defend your unit targets to lenders and stakeholders. Vague claims like "we'll sell 100 cars a year" lack credibility. Specific claims like "we'll capture 12% market share (60 units) by converting 8% of 750 monthly prospects" show you understand your conversion funnel. According to conversion rate research, dealership conversion rates range from 2–10% depending on lead source and follow-up discipline, with top performers reaching 15.7%.
Set monthly unit targets by dividing your annual goal into quarters and months, accounting for seasonal variation. Most dealerships see 15–20% higher sales in spring and fall. Your operational plan must specify how many salespeople you need per unit target—typically one salesperson closes 8–12 units monthly if they're properly trained and supported. If your target is 40 units monthly, you need 4–5 sales staff.
Protecting Margin Through Smart Sourcing and Pricing
Margin protection begins before a customer walks onto your lot. For used car dealers, sourcing strategy directly determines gross profit. Per industry benchmarks, used vehicle gross profit per unit reached $1,668 in Q2 2025, but top-performing stores achieve $2,000–$3,000 front-end gross and $1,200–$1,800 back-end gross per unit, with exceptional operations hitting $3,500+ total gross per unit.
This variance reflects sourcing discipline. Dealers who buy inventory at auction without a clear reconditioning plan and target margin often overpay. Build a sourcing matrix: define which vehicle types, model years, and mileage ranges fit your market and margin targets. If your market demands 2015–2019 sedans with under 80,000 miles, and your target margin is $2,500 front-end, you can only pay up to a specific acquisition cost. Stick to it. Dealers who chase inventory and ignore acquisition cost discipline erode margins quickly.
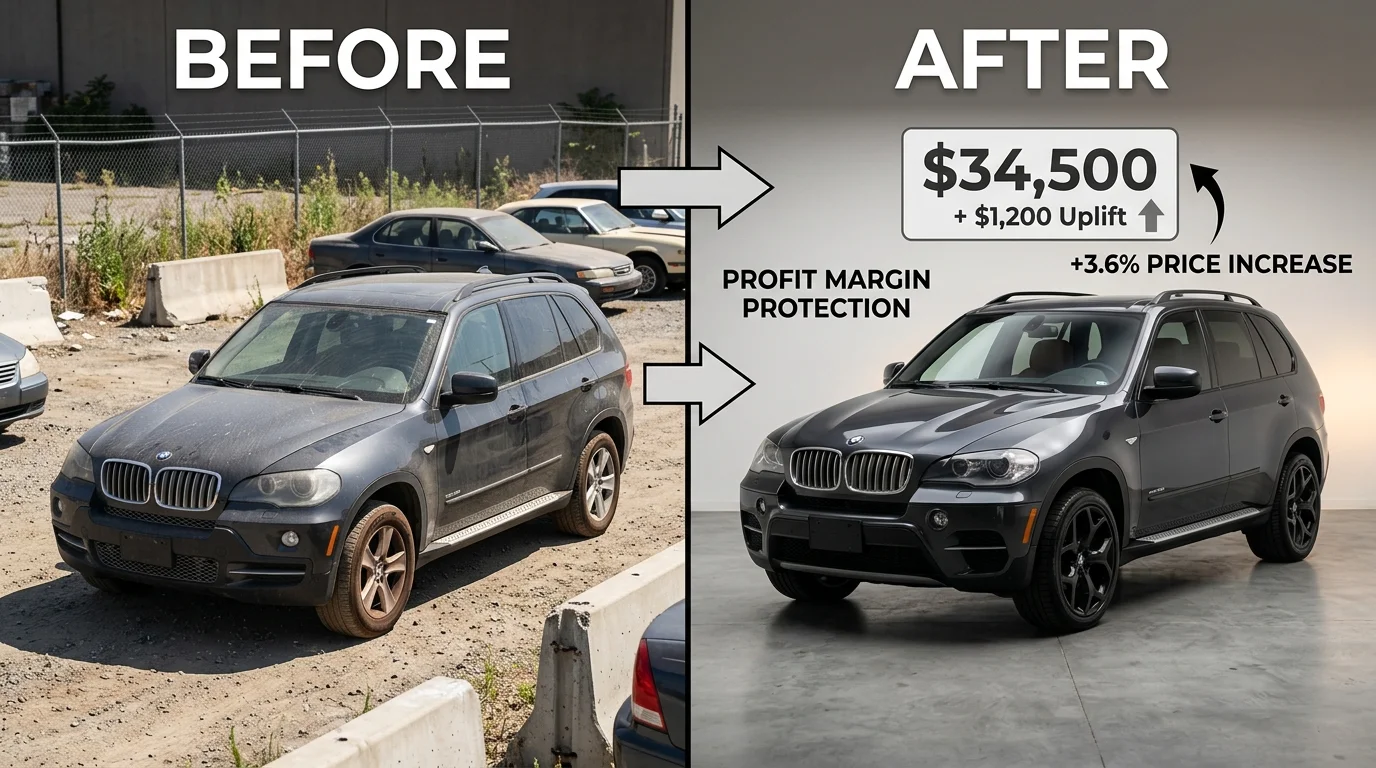
Reconditioning strategy amplifies margin. A $500 detailing investment that allows you to price a vehicle $1,200 higher protects your gross profit and speeds inventory velocity. Conversely, cosmetic shortcuts that force you to discount $800 destroy profitability. Document your reconditioning standards: mechanical inspection checklist, detailing scope, warranty commitments. This consistency also protects your reputation and reduces return rates.
Pricing strategy must reflect market conditions without triggering unnecessary discounting. Use market data tools to price competitively—overpriced inventory sits, forcing markdowns that destroy the margin you tried to protect. Underpriced inventory sells fast but leaves money on the table. Price within 2–3% of comparable vehicles in your market. Reserve discounting for aged inventory (60+ days) or vehicles with minor cosmetic issues, not as your default negotiation tactic. Train your sales team to defend price through value (warranty, reconditioning, service history) rather than conceding margin.
For new car dealers, gross profit per vehicle averaged $3,284 in Q2 2025, but margin protection relies on controlling incentive spending and F&I penetration. F&I products contributed an average of $2,515 gross profit per vehicle, representing 30–40% of total dealership gross profit. Ensure your business plan accounts for realistic F&I attachment rates and back-end gross targets—these often exceed front-end margin and deserve dedicated attention in your operational workflow.
Inventory velocity is your third margin lever. Fast-turning inventory reduces carrying costs and floor plan interest, protecting gross profit even at tighter per-unit margins. Target 45–60 days average days in inventory for used vehicles; anything beyond 90 days signals sourcing or pricing problems that will drain cash. Track velocity by vehicle type and adjust sourcing or pricing accordingly. High-velocity inventory also frees capital for fresh stock, creating a virtuous cycle.
Financial Projections: Translating Operations Into Numbers
Your operational assumptions—unit sales volume, gross margin per vehicle, inventory turnover, staffing levels—mean nothing without translation into a financial model. A credible business plan requires a 3–5 year projection that connects these metrics to revenue, cost of goods sold, operating expenses, and ultimately EBITDA. This isn't theoretical accounting; it's the document lenders, investors, and your own management team will use to assess whether the dealership can survive its first 18 months and scale profitably.
Calculating Minimum Capital Required and Startup Costs
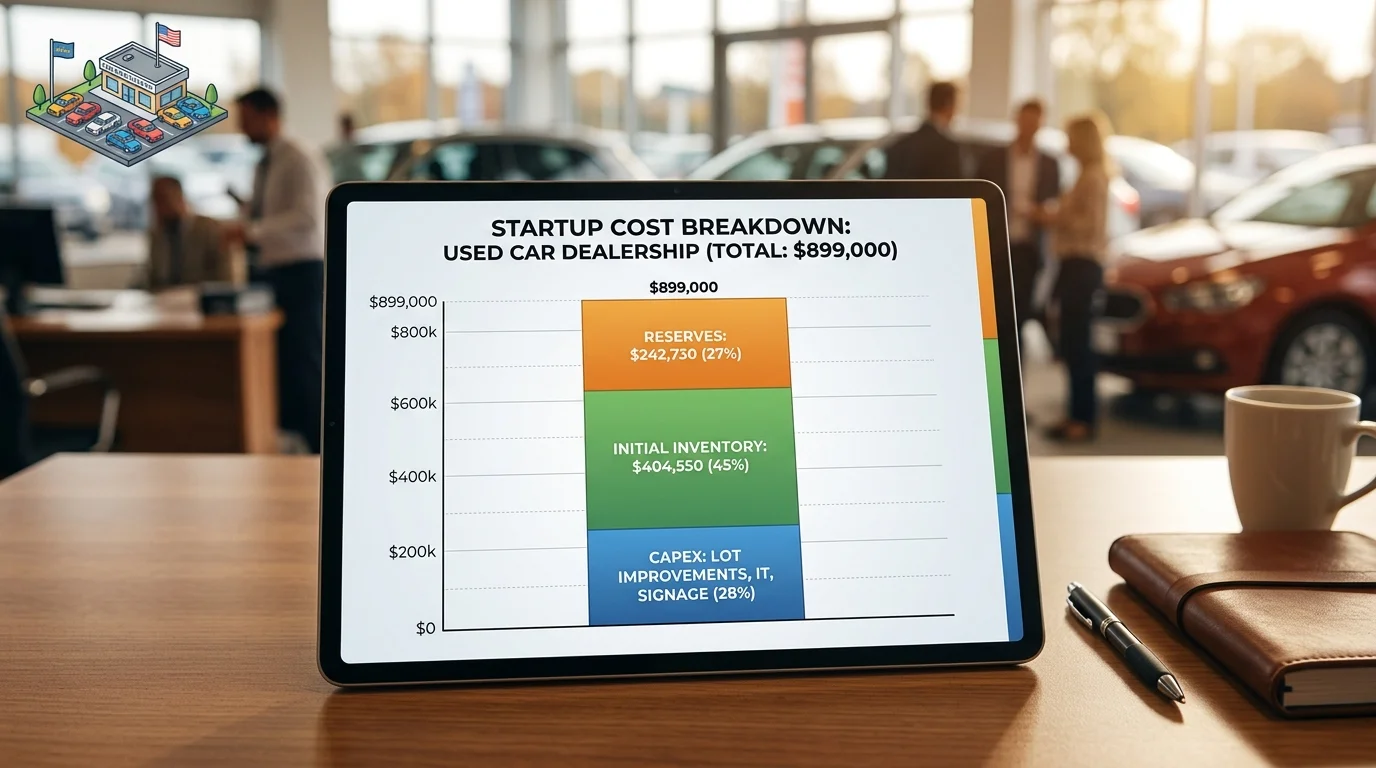
Before you sell a single vehicle, you must fund the operation. According to research on dealership startup costs, a used car dealership requires approximately $899,000 in minimum cash reserves to cover initial inventory and overhead, with capital expenditures around $232,000 for lot improvements, signage, IT infrastructure, and service equipment. For new car franchises, capital requirements climb to $5–10 million or more, including franchise fees alone of $500,000–$2 million.
Break your startup costs into three buckets: one-time capital expenditures (CAPEX), initial inventory investment, and working capital reserves. CAPEX includes lot paving, lighting, office buildout, point-of-sale systems, customer management software, and security infrastructure. Initial inventory typically represents your largest single expense; a 25–30 vehicle used lot requires roughly $650,000 at an average acquisition cost of $25,000 per unit. Working capital—cash to cover payroll, utilities, and marketing before gross profit flows in—should equal 2–3 months of fixed operating expenses, or roughly $112,500–$168,750 for a used dealership.
Total funding required is the sum of these three components. If you're bootstrapping, this determines how much capital you need to raise or contribute personally. If you're seeking a bank line of credit, lenders will scrutinize this calculation and expect you to defend each line item. Underestimating startup costs is a common failure point; dealerships that run out of cash in month 4 because they forgot to budget for insurance, licensing, or initial marketing cannot recover.
Staffing Plan and Headcount Trajectory
Your payroll is your largest controllable operating expense. A typical used dealership starts lean: 2–3 sales consultants, 1 F&I manager, 1 operations/lot manager, and 1 owner/general manager. Monthly fixed operating expenses for a used car dealership run approximately $56,250 (or $675,000 annually) before inventory costs, with salaries and commissions representing 35–45% of that total.
Build a staffing model that scales with growth. Year 1 might operate with 5 FTEs (full-time equivalents) and $180,000 in annual salary expense plus 8–10% commission on gross profit. By Year 3, as unit volume grows from 15 vehicles per month to 40+, you'll add a second F&I specialist, a detail/reconditioning technician, and a marketing coordinator—bringing headcount to 8–10 FTEs and salary expense to $320,000–$380,000 annually. Commission structures should remain tied to gross profit, not just unit count, to prevent margin erosion as you scale.
Project FTE growth and salary cost in your financial model alongside revenue growth. If unit sales triple but headcount only doubles, you've improved productivity and leverage—a positive signal to investors. Conversely, if headcount grows faster than revenue, your model signals operational inefficiency and margin compression.
| Year | Units/Month | Sales FTEs | F&I/Ops FTEs | Total FTEs | Annual Salary + Commission |
|---|---|---|---|---|---|
| 1 | 15 | 3 | 2 | 5 | $180,000 |
| 2 | 28 | 5 | 3 | 8 | $280,000 |
| 3 | 42 | 7 | 4 | 11 | $380,000 |
Link headcount and compensation directly to your revenue and gross profit projections. This ensures your P&L is internally consistent and defensible. When you present the plan to a lender or investor, they'll immediately spot if your staffing assumptions don't align with your sales targets—and they'll reject the plan if they don't.
Practical Steps to Write and Finalize Your Car Sales Business Plan
Writing a dealership business plan is not an abstract exercise—it's the process of translating your operational vision into a document that guides hiring, capital allocation, and daily execution. The steps below move you from concept to a plan that both lenders and your team can act on.
Validating Your Assumptions and Setting Realistic Targets
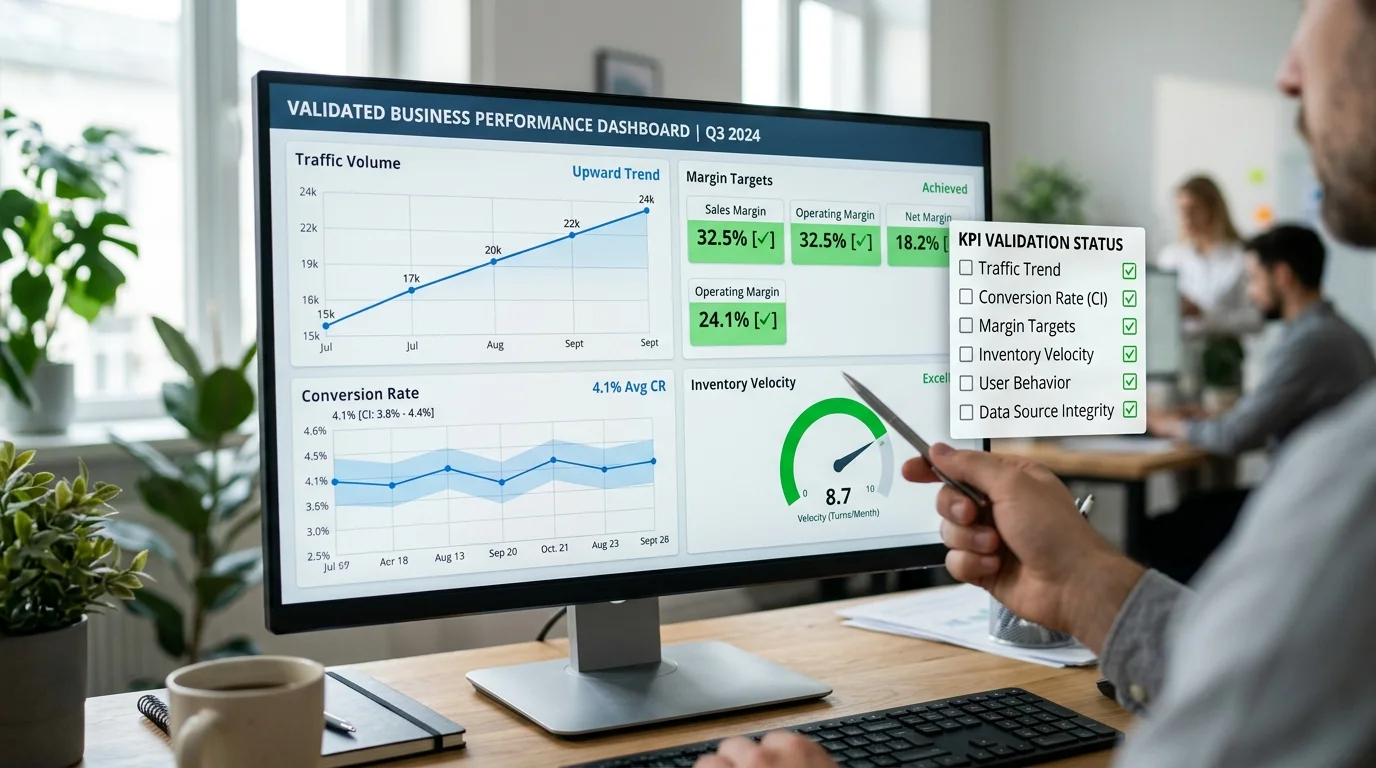
Before you commit numbers to paper, pressure-test every assumption against reality. Start with traffic volume: How many qualified buyers will walk onto your lot or visit your website each month? Don't guess. If you're opening a new location, study competitor foot traffic in that area, analyze local demographics, and cross-reference with industry benchmarks for your market segment. If you're expanding an existing dealership, use your historical data—but adjust for seasonal swings, economic conditions, and competitive changes.
Conversion rates are where most plans fail. Many new dealerships assume 15–20% of traffic converts to a sale; industry reality is closer to 5–10%, depending on inventory quality and sales team experience. Test this assumption by talking to other dealers in your region, reviewing your own historical close rates, and factoring in the quality of your sourcing strategy. If you're planning to stock luxury vehicles, your conversion rate may be lower but your gross profit per unit higher—make sure your P&L reflects this trade-off.
Margin targets require the same rigor. Gross profit per unit varies by segment: used economy cars typically yield $1,500–$3,000; mid-market vehicles, $3,000–$6,000; luxury or specialty vehicles, $6,000–$15,000+. Don't assume you'll hit the high end of the range in year one. Conservative planning means targeting the median for your segment, then building upside into your forecast. Velocity checks—how many days inventory sits before sale—directly impact your working capital needs and carrying costs. A 45-day average inventory cycle is healthy; 90+ days signals sourcing or pricing problems that will drain cash.
Unit target validation ties everything together. If you project 15 units per month but your market research suggests your location can realistically absorb 8–10 units, your entire financial model is built on sand. Cross-check your unit targets against market size, competitor capacity, and your team's ability to execute. A smaller, achievable target is far more credible to lenders than an inflated projection you can't defend.
Preparing Your Plan for Lenders, Partners, and Investors
External stakeholders—banks, equipment lessors, investors—evaluate your plan through a consistent lens: Can you execute, and will you repay or deliver returns? This means your assumptions must be transparent, conservative, and defensible.
Lenders specifically want to see clear cash flow projections. They care less about your year-three profit margin than whether you'll have enough cash to cover payroll and debt service in months 4–8, when working capital is tightest. Include a monthly cash flow statement for at least the first 18 months, showing inventory purchases, payables, receivables, and loan repayment schedules. If your plan shows profitability but negative cash flow in month 6, you need a credit line or equity injection—and lenders need to see that plan explicitly.
Realistic funding requests matter enormously. If you ask for $500K to open a dealership but your plan shows you need $650K to cover inventory, buildout, and working capital through breakeven, lenders will reject the plan immediately—not because the business is bad, but because you've demonstrated you don't understand your own numbers. Build in a 10–15% contingency buffer for unexpected costs (regulatory compliance, lot improvements, staffing delays) and state it openly.
Your management team's credibility is inseparable from the plan itself. Include brief bios of key leaders—sales manager, F&I manager, operations lead—with their relevant experience. If you're hiring these roles, say so and explain your recruitment timeline. Investors and lenders want to know who will execute the plan day-to-day, not just who wrote it.
Consider pairing your written plan with a one-page investment pitch deck or executive summary. This should distill your market opportunity, competitive advantage, financial highlights (year-one revenue, gross profit, unit volume), and funding ask into a visual format. Many lenders and investors will skim the deck first; if it doesn't grab them, they won't read the full plan. The deck should answer three questions: Why this market? Why your team? Why now?
Finally, build flexibility into your plan's presentation. Have a base case (your realistic scenario), a downside case (20% lower unit volume, 10% lower margins), and an upside case (faster ramp, higher conversion). This shows lenders you've thought through risk and won't panic if month-one results miss projections by 15%. It also demonstrates financial literacy—a hallmark of operators who survive downturns.
Frequently Asked Questions About Car Sales Business Plans
How long should a business plan be?
Length depends on your audience and purpose. A startup dealership seeking bank financing typically needs 15–25 pages: executive summary, market analysis, operational plan, financial projections, and management bios. If you're pitching to investors, add a one-page deck summarizing your opportunity, team, and funding ask. Internal operational plans can be shorter—10–15 pages—since you're not explaining basics to outsiders. The rule: be thorough enough to answer every stakeholder question, but concise enough that decision-makers actually read it. Padding with filler kills credibility.
Do I need a business plan if I'm not seeking funding?
Yes. A written plan forces clarity on unit volume targets, gross margin assumptions, staffing needs, and cash flow timing—decisions you'll make anyway. Without a plan, you're flying blind on inventory turnover, break-even timing, and how much working capital you truly need. Even if you're self-funded, a plan becomes your operational scorecard: measure actual results against projections monthly, adjust tactics, and avoid costly surprises.
How often should I update my plan?
Review quarterly and revise annually. After your first 90 days of actual operations, compare real unit sales, margins, and expenses to projections. If actuals diverge by more than 15%, update your full-year forecast. Annually, reset your three-year outlook based on market conditions, competitive moves, and your team's execution track record. A stale plan is worse than no plan—it breeds false confidence.
What's a realistic timeline to profitability for a new dealership?
Most independent dealerships break even within 18–24 months if capitalized properly and located in decent markets. Months 1–6 are typically negative (inventory investment, staffing, marketing outflow). Months 7–12 show gross profit but may not cover fixed costs. By month 18–24, unit volume and repeat customer traffic usually generate positive net income. Luxury or niche segments may take longer; high-volume used-car lots can turn faster. Your plan should model this explicitly—lenders expect it.
How do I know if my financial projections are realistic?
Benchmark against industry data: used-car dealers average 8–12 units per salesperson monthly; gross margins range 12–18% depending on segment. Cross-check your unit volume against local market size and your competitive position. If you're projecting 50 units monthly but your market supports 200 total and you're a new entrant, that's optimistic. Test your staffing model: can one F&I manager handle your projected deal volume? Stress-test downside scenarios—what if margins drop 10% or volume misses by 20%? If your plan survives that, it's credible.
Taking Action: Next Steps to Build Your Car Sales Business Plan
Your business plan is only valuable when it drives decision-making. Start by identifying your unique competitive advantage—whether that's niche inventory expertise, superior customer service, or operational efficiency—then build your operational and financial model around that strength. This focus prevents you from chasing generic best practices and keeps your plan grounded in what you actually do better than competitors.
Next, operationalize the plan: assign accountability for each section, set quarterly review cycles, and treat projections as living documents, not static forecasts. When reality diverges from your plan (unit sales miss, margins compress, market shifts), update it rather than ignore it. This discipline separates dealerships that survive downturns from those that don't.
One critical operational lever many dealers overlook is vehicle presentation quality. Professional photography directly impacts customer acquisition cost and conversion rates—lot photos drive clicks, studio-quality images drive inquiries. Tools that transform ordinary inventory shots into polished, studio-quality listings can meaningfully improve your online-to-showroom funnel without the expense of traditional studio photography.
Your plan execution begins today. Document your value proposition, stress-test your numbers, and commit to operational discipline. The dealerships that succeed aren't those with perfect forecasts—they're the ones with honest plans and the discipline to execute and adapt them.